Index
Prequisites
To use this indicator you should have available the following prequisites
- Quantower trading platform at least version v1.141.19. Click to Download the platform
- Free Quantower License. Click Here to get one
- automated-trading.ch Account with Premium Subscription
We highly recommend joining our discord community by following this invite link
![]()
Description
The PriceAction 2nd Entry indicator is a Premium Quantower indicator that shows 2nd Entries signal as defined by Mack's PATS strategy from priceactiontradingsystem.com
To learn more about the PATS 2nd Entry strategy, please have a look at those resources:
- Youtube explaining video : How to count Entries
- Tradedevils equivalent indicator
The idea behind the 2nd entry indicator is that price moves in a 2 wave pattern composed of a First pullback that generates a failed attempt to break the 1st swing in the move. Then followed by a second high probability pullback that pushes the price to move a certain numbe of ticks that can traded for profit. This pattern happens very frequently during the trading session.
Examples
On the below example, you can see the 2nd Entry indicator in action on ES-2000 Ticks timeframe:
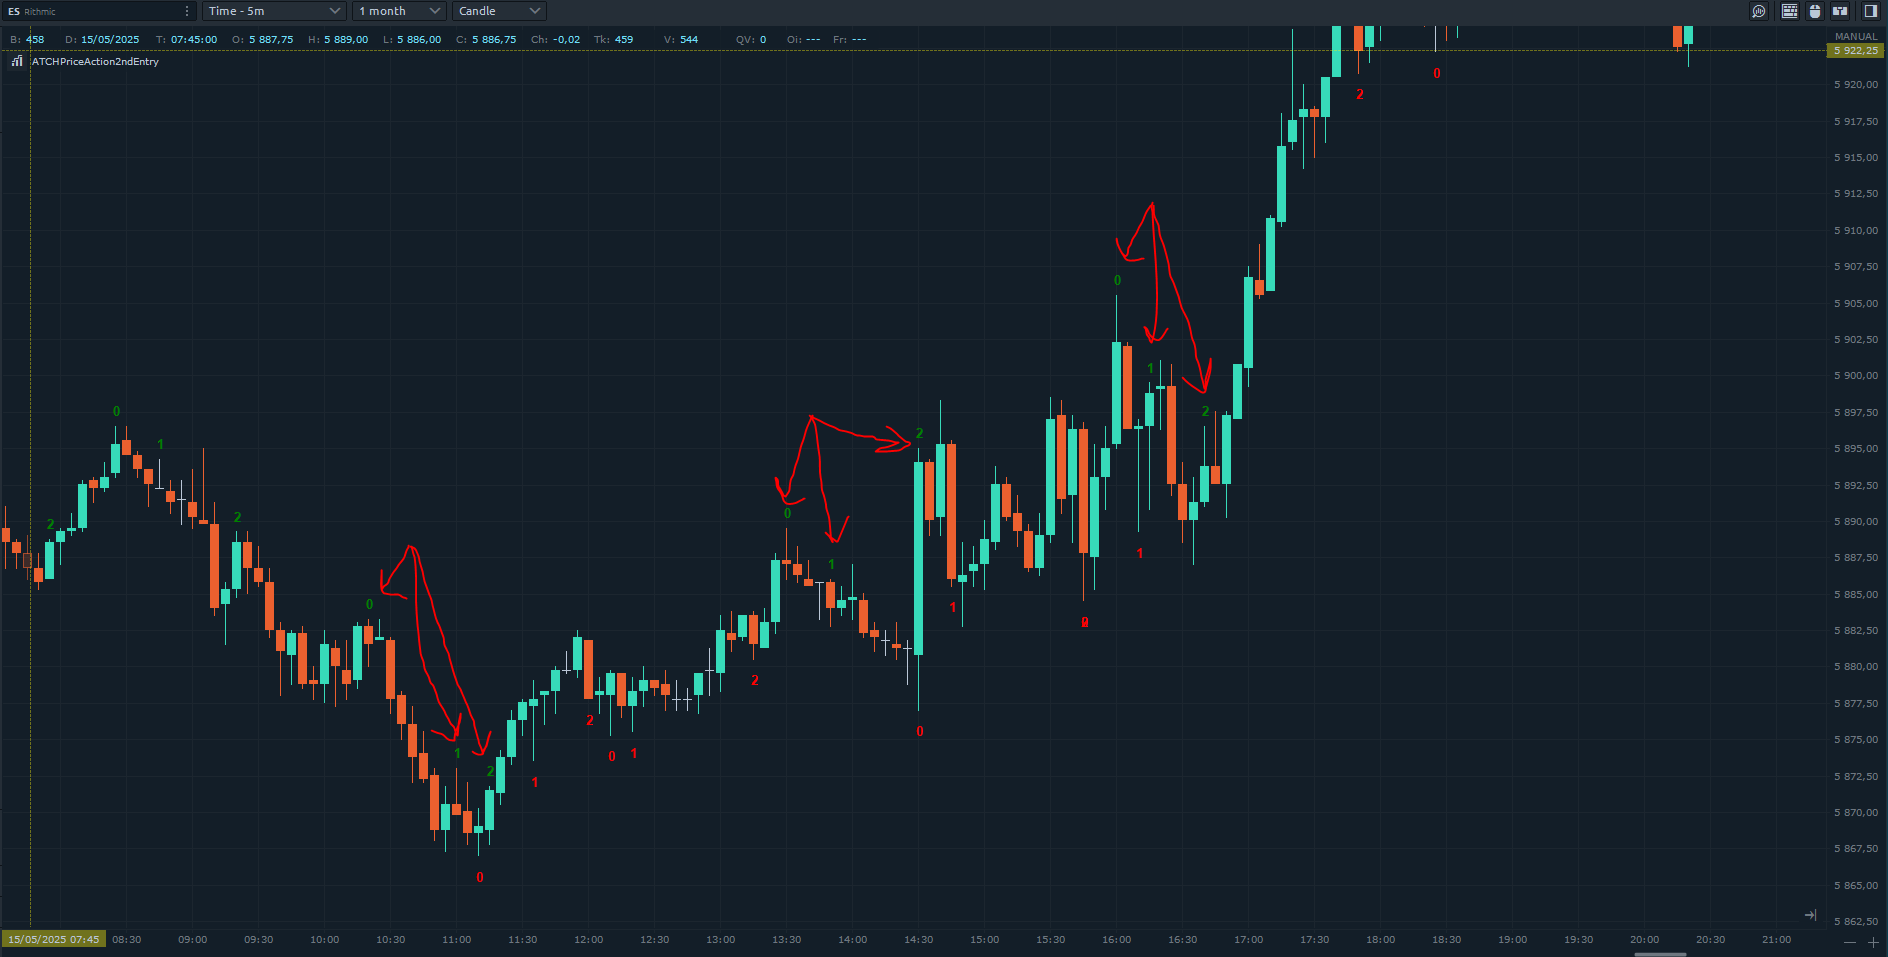
The first thing to notice is that indicator draws counting numbers in two colors. Green for bullish and Red for bearish. These brush colors can offcourse be modified according to your taste. Each counting sequence start with a Higher-High for bullish sequences, and with a Lower-Low for bearish sequences. At that swing point price, the indicator will print the number 0
If after drawing 0 on a level, the price breaks that swing points and make a new Higher-High or a new Lower-Low, the drawn 0 will be removed and a new 0 will be drawn marking the start of a new counting sequence.
The algorithm then searches for the first failed attempt to occur. The 1st failed attempt is defined by the price pulling back at least one tick higher or lower than the previous price bar, then going back to going farther from the initial start of counting sequence (meaning going down for bullish sequence, or going up for a bearish sequence.) If the price, after pulling back continues and breaks the inital start of the counting sequence, then the pattern is marked as invalid and it will be removed from drawing.
After detecting the 1st failed attempt, the algorithm seeks the 2nd attempt which will be the high prbability entry setup in the context of a continuation in trend. The second attempt is the second pullback where the price breaks the previous candle higher (for bullish pattern) or lower (for bearish pattern) wick, and closes with a green (for bullish pattern) or red candle (for bearish pattern)
When this happens, the indicator will draw an arrow marking a valid high probability entry signal, and if when enabled, the indicator will play a sound.
This logic is illustrated on the image above where you can spot bullish continuation signals marked by the red arrows pointing to the 2nd entry patterns and signals
Features
The Price Action Second Entry indicator has a set of unique features
- Replace your manual counting efforts with mechanical counting
- Can play a sound on each detected entry signal along with a drawn arrow
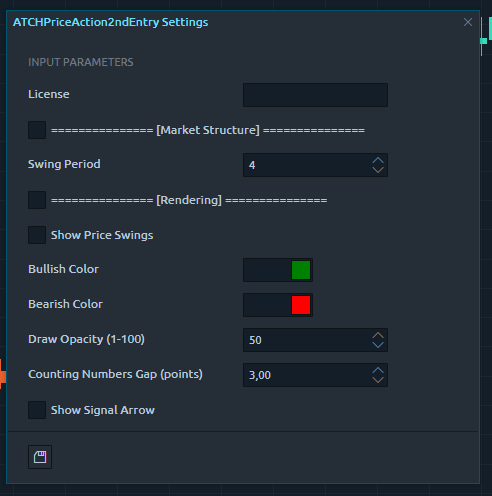
Parameters
We always try to keep the parameters to minimum.
| License | |
| License | This is the license key you get when you create an account on automated-trading.ch. After creating an account, copy your license key from the billing page. You need to set this parameter only once, once the license key is validated it will be remembered. |
| Market Structure | |
| Swing Period | Swings are higher lows,higher highs, lower highs and lower lows. After each price bar close, a swing can be detected. But just after that, the next bar can cancel the swing at the previous bar by creating a new swing of the same type. Or this can happen on the second bar, or the third, etc... The swing period sets how many bars is enough to seperate two swings of the same type. The more you increase this parameter, the more you decrease the number of swings overall. The more you decrease this parameter, the more you increase the number of overall swings. I personally use the value of 3 or 4 for this parameter. |
| Rendering | |
| Show Price Swings | Control showing or not the swing points on the chart as small rectangles above/below candles |
| Bullish Color | Draw Color of bullish items to draw on the chart |
| Bearish Color | Draw Color of bearish items to draw on the chart |
| Render Opacity (1-100) | The opacity to render sequence counting numbers on the chart |
| Counting Numbers Gap (points) | Control the drawing gap in points between the candle wicks and the drawing of the counting numbers |
| Show Signal Arrow | Control showing or not the entry signals arrow |
| Sound Alert | |
| Play Sound | This parameter will enable playing an alert sound when an entry signal is detected |
| Play Sound File | This parameter will set the file name to be played on sound alert. This can be set to any .wav file on your computer |
Download & Installation Instructions
To download and install the indicator follow the instructions below
- Click on the below download button to download the Indicator file
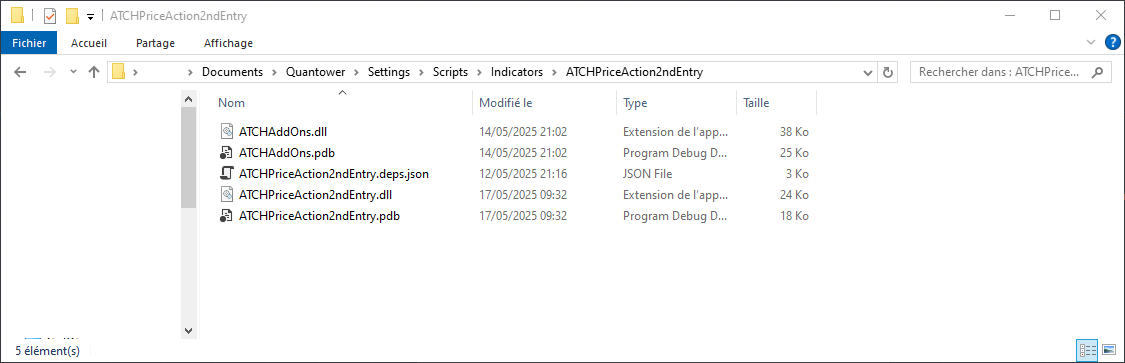
- As illustrated on the image below, extract the whole content of the zip file into your Quantower indicators folder. The indicators folder can be found by default following this path : {C:\Users\{Windows Username}\Documents}\Quantower\Settings\Scripts\Indicators
- Make sure the files are extracted inside a new folder called ATCHPriceAction2ndEntry
- Next, open a new chart window
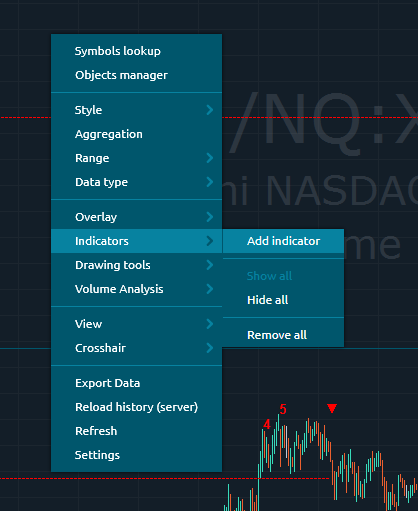
- After copying the indicator files and opening a new Chart window you should be able to add the indicator to the chart. Right-click on the chart and click on Indicators -> Add Indicator
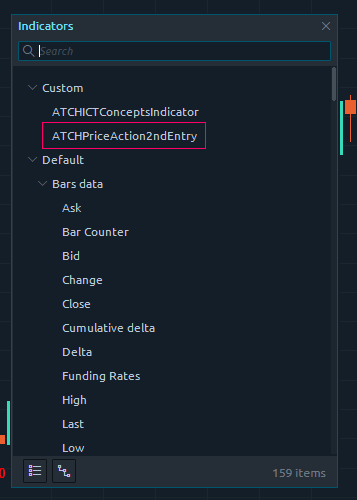
- Then select the Custom/ATCHPriceAction2ndEntry entry from the indicators list and Double-Click on it
- After that, you will be able to set the parameters of the indicator in the next panel. At this stage, the indicator should be already added to the chart
- At this stage, you should copy/paste your license number into the License parameter, you can find your license number Here
- If your License was not successfully recognized. You will see an error message on the Chart.
- After adding the indicator to the chart and succesfully submitting your License number, the indicator will be run on Historical data for a couple of seconds
- After this step, the indicator is added with success and will continue to run on live market data
Frequantly Asked Questions
General
Yes, If you have an idea that you believe can improve this indicator, I will be more then happy to hear from you. Please use the contact page to send me a message
No, the source code of the indicator is protected for copyright reasons
No, this indicator only do rendering and doesn't provide data that can be used from within a strategy.
Subscriptions Q&A
Yes, you can Cancel/Resume your subscription with a click of a button with no questions asked. You don't even need to request something or send a message. You can manage your subscription in a completely autonomous way.
Our products will verify the license validity at 1st day of each month. At that date, you need to provide the license number to the product (with a simple copy/paste) so that it will be valid to the rest of the month.
We do not store payment credentials, they are encrypted and passed to Stripe or PayPal for a safe & secure way to purchase subscriptions on our site.
Please send us a message from the Contact Page
Release Notes
- First Release of the indicator
User Comments & Feedback
You can find feedback of our users and ask questions about this strategy by joining our discord community by following this invite link or clicking on the Discord logo image. Joining is completely free
![]()